Abstract
Micro-CT scan images enhanced by iodine staining provide high-resolution visualisation of soft tissues in laboratory mice. We have compared Micro-CT scan-derived left ventricular (LV) mass with dissection and weighing. Ex-vivo micro-CT scan images of the mouse hearts were obtained following staining by iodine. The LV was segmented and its volume was assessed using a semi-automated method by Drishti software. The left ventricle was then dissected in the laboratory and its actual weight was measured and compared against the estimated results. LV mass was calculated multiplying its estimated volume and myocardial specific gravity. Thirty-five iodine-stained post-natal mouse hearts were studied. Mice were of either sex and 68 to 352 days old (median age 202 days with interquartile range 103 to 245 days) at the time of sacrifice. Samples were from 20 genetically diverse strains. Median mouse body weight was 29 g with interquartile range 24 to 34 g. Left Ventricular weights ranged from 40.0 to 116.7 mg. The segmented LV mass estimated from micro-CT scan and directly measured dissected LV mass were strongly correlated (R2 = 0. 97). Segmented LV mass derived from Micro-CT images was very similar to the physically dissected LV mass (mean difference = 0.09 mg; 95% confidence interval - 3.29 mg to 3.1 mg). Micro-CT scanning provides a non-destructive, efficient and accurate visualisation tool for anatomical analysis of animal heart models of human cardiovascular conditions. Iodine-stained soft tissue imaging empowers researchers to perform qualitative and quantitative assessment of the cardiac structures with preservation of the samples for future histological analysis.

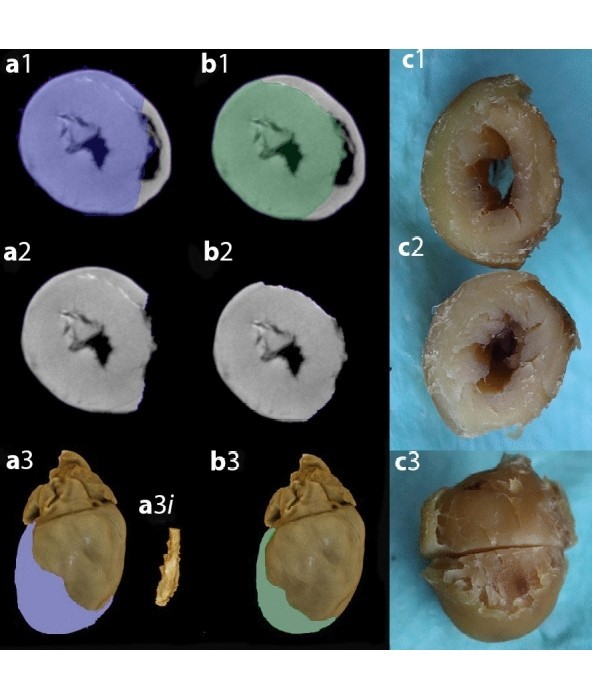
Figure 5 Images from one heart showing differences in Virtual dissection by observer 1 (a) and Observer 2 (b) and physical dissection (c). Images were chosen to illustrate points made in the text rather than to represent average differences. Selections made by Observer 1 are labelled a1, a2 etc. Selections made by Observer 2 are labelled b1, b2 etc. Photographs of the physically dissected heart are shown in the right panel labelled c. Panel a1 shows the region selected as being the left ventricle (LV) by Observer 1 (blue shaded area) and Panel b1 shows the region selected as being the LV by Observer 2 (green shaded area). The area selected as being LV by Observer 1 (panel a2) was greater than the area selected as LV by Observer 2 (panel b2). Panels a3 and b3 show the three-dimensional structure of the heart with the unselected surfaces in brown and the selected areas in blue (Observer1, a3) or green (Observer 2, b3). Observer 1 and 2 show close agreement in removal of supra ventricular structures. The surface attributed to right ventricular free wall by Observer 1 is less than the surface attributed to right ventricular free wall by Observer 2. a3i shows LV clot segmented and removed by Observer 1. Photographs of cut surface of LV and base of heart (c1), cut surface of LV and apex of heart (c2) and the LV with cut surfaces apposed and the right ventricle removed exposing the septal surface of the RV (c3). Imprecision in physical dissection is apparent in the ragged edges where the RV free wall was removed.